
IT Now
This page updates on Fridays on a weekly base.
Italy GDP Nowcast Report
The Italian GDP nowcasts are constructed using the Mixed Frequency Bayesian Vector AutoRegressive (MFBVAR) model as in Schorfheide and Song (2015, JBES). The MFBVAR model is estimated using the Empirical Macro Toolbox, see Ferroni and Canova (2020).
Vintage date: 24-Jul-2026
Nowcast quarter: 2026:II
Summary: Italy’s Q2-2026 GDP nowcast is 1.6% YoY and 0.8% QoQ. Versus the prior week, both figures are unchanged (0.0 pp revision). The report shows no new releases since the previous vintage; earlier May trade prints (exports +0.20% MoM, imports +1.45% MoM) were already incorporated.
1. Latest nowcast
Latest nowcast (median, 20 and 80 percentiles) based on vintage 24-Jul-2026:
- YoY growth (%):
1.60[1.46,1.72] - QoQ growth (%):
0.80[0.66,0.92] - GDP log level:
4.7223[4.7209,4.7236]
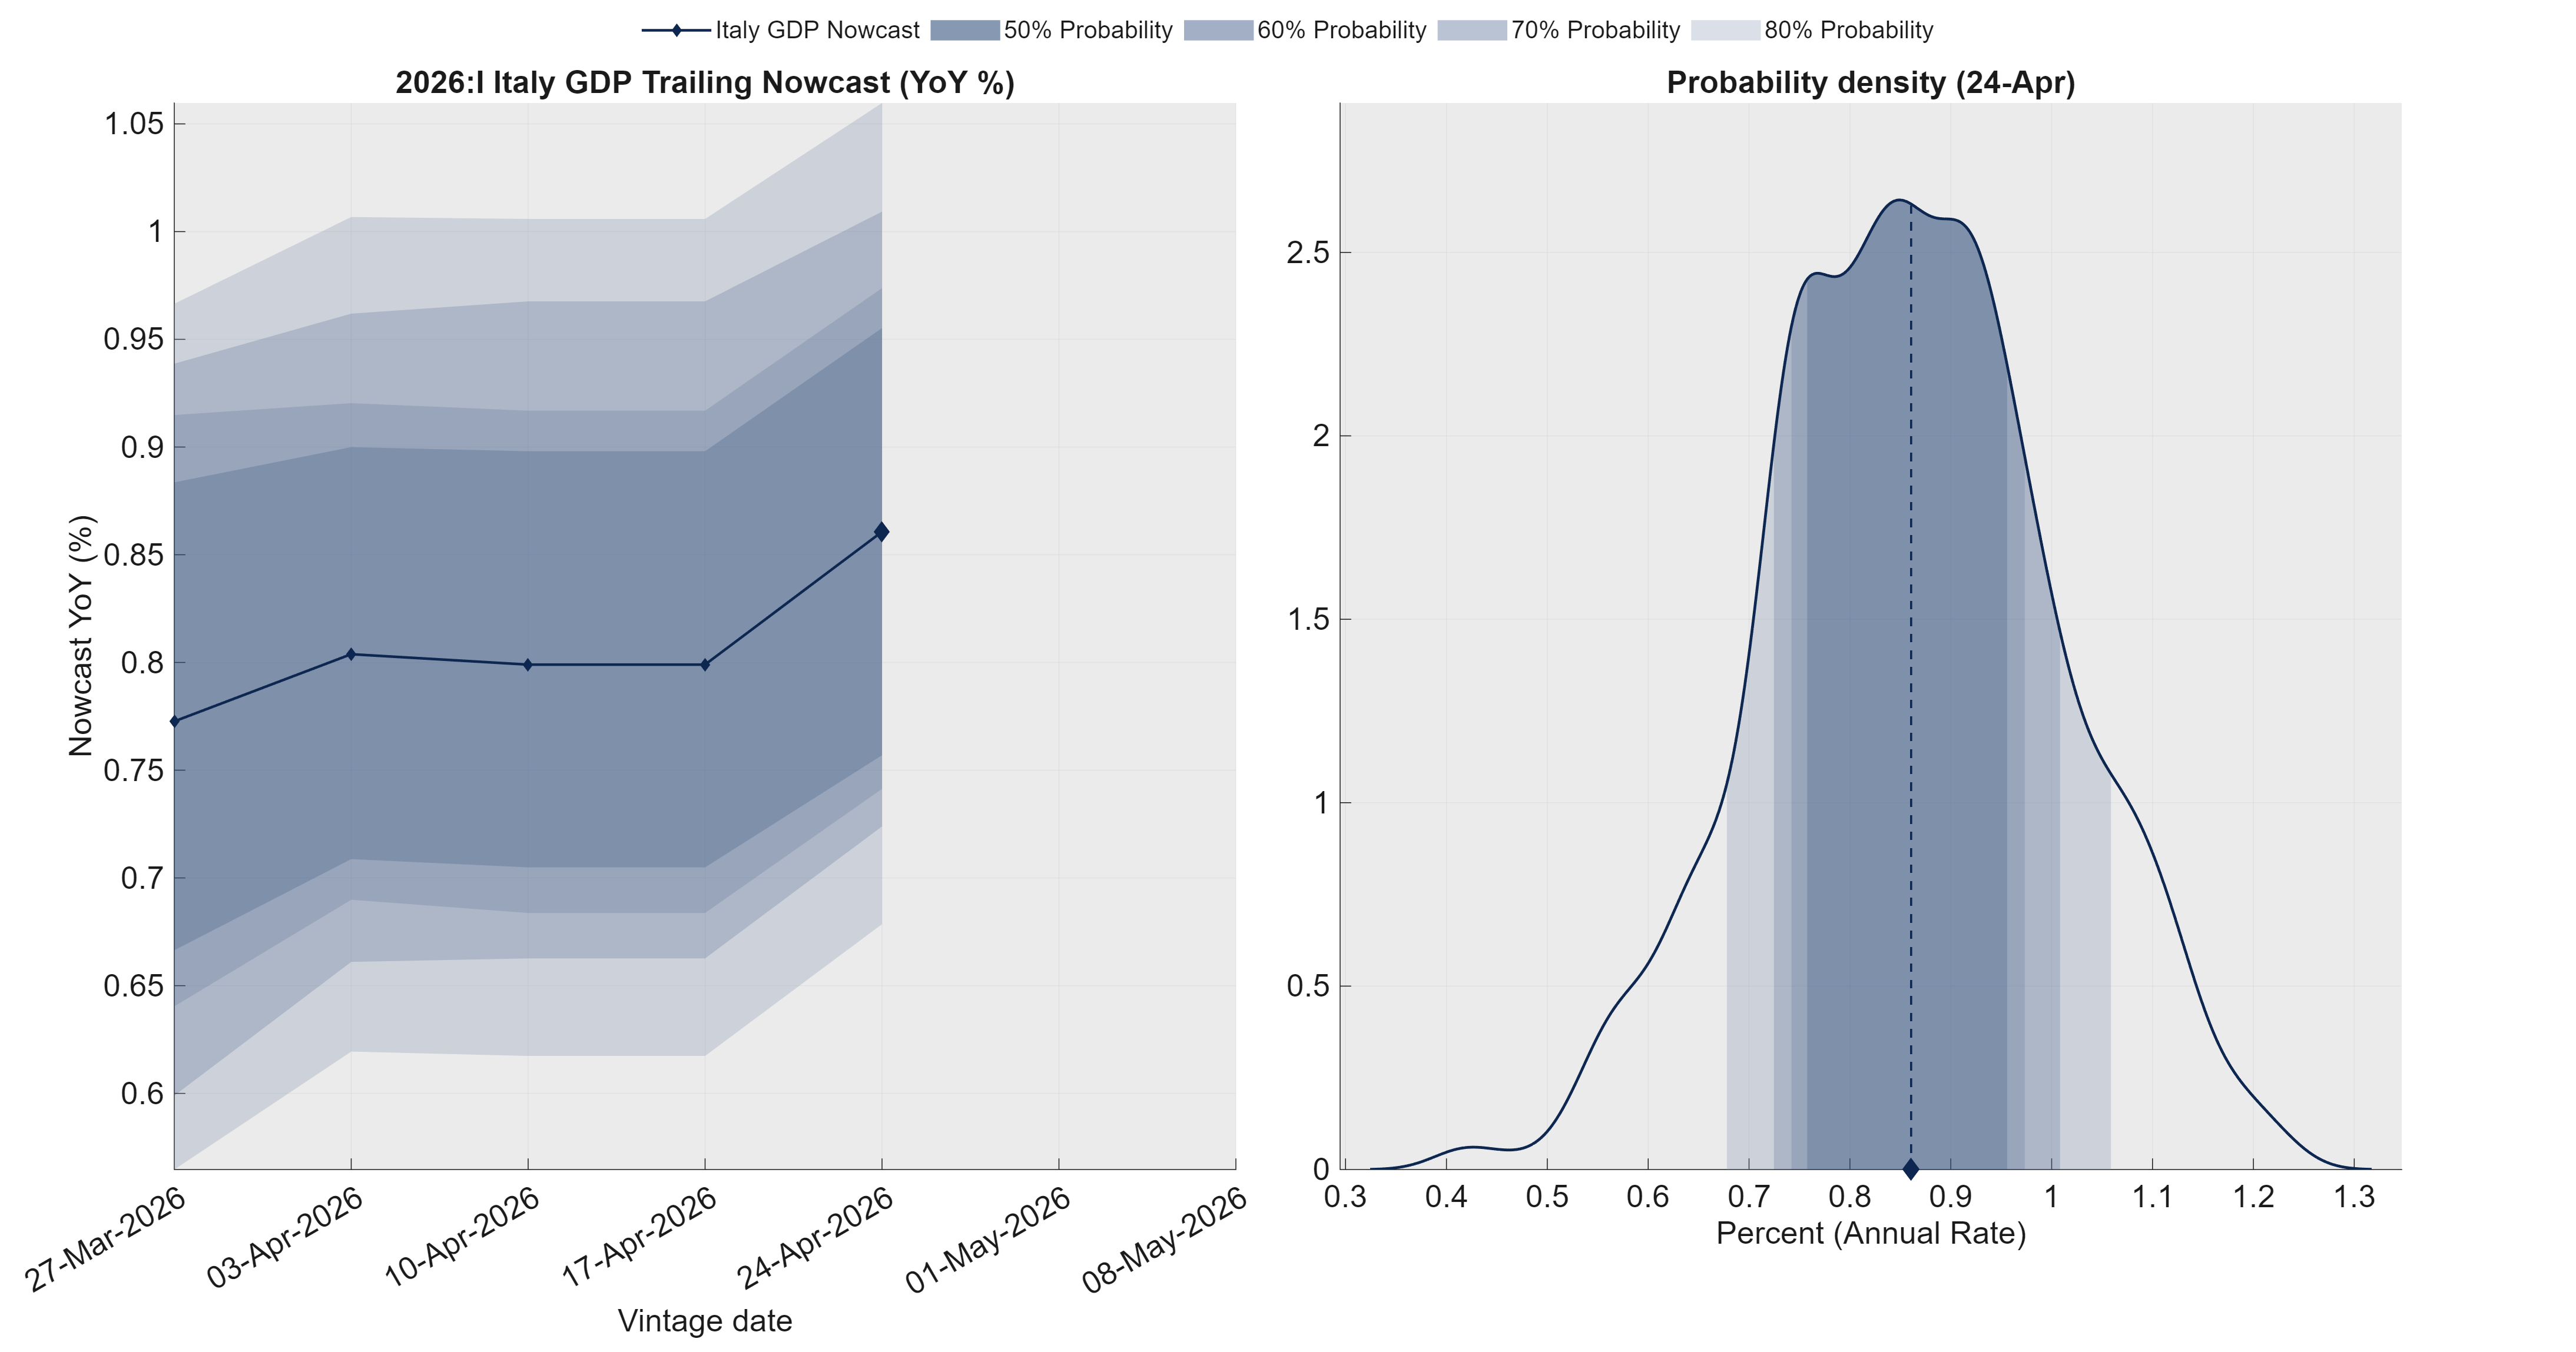
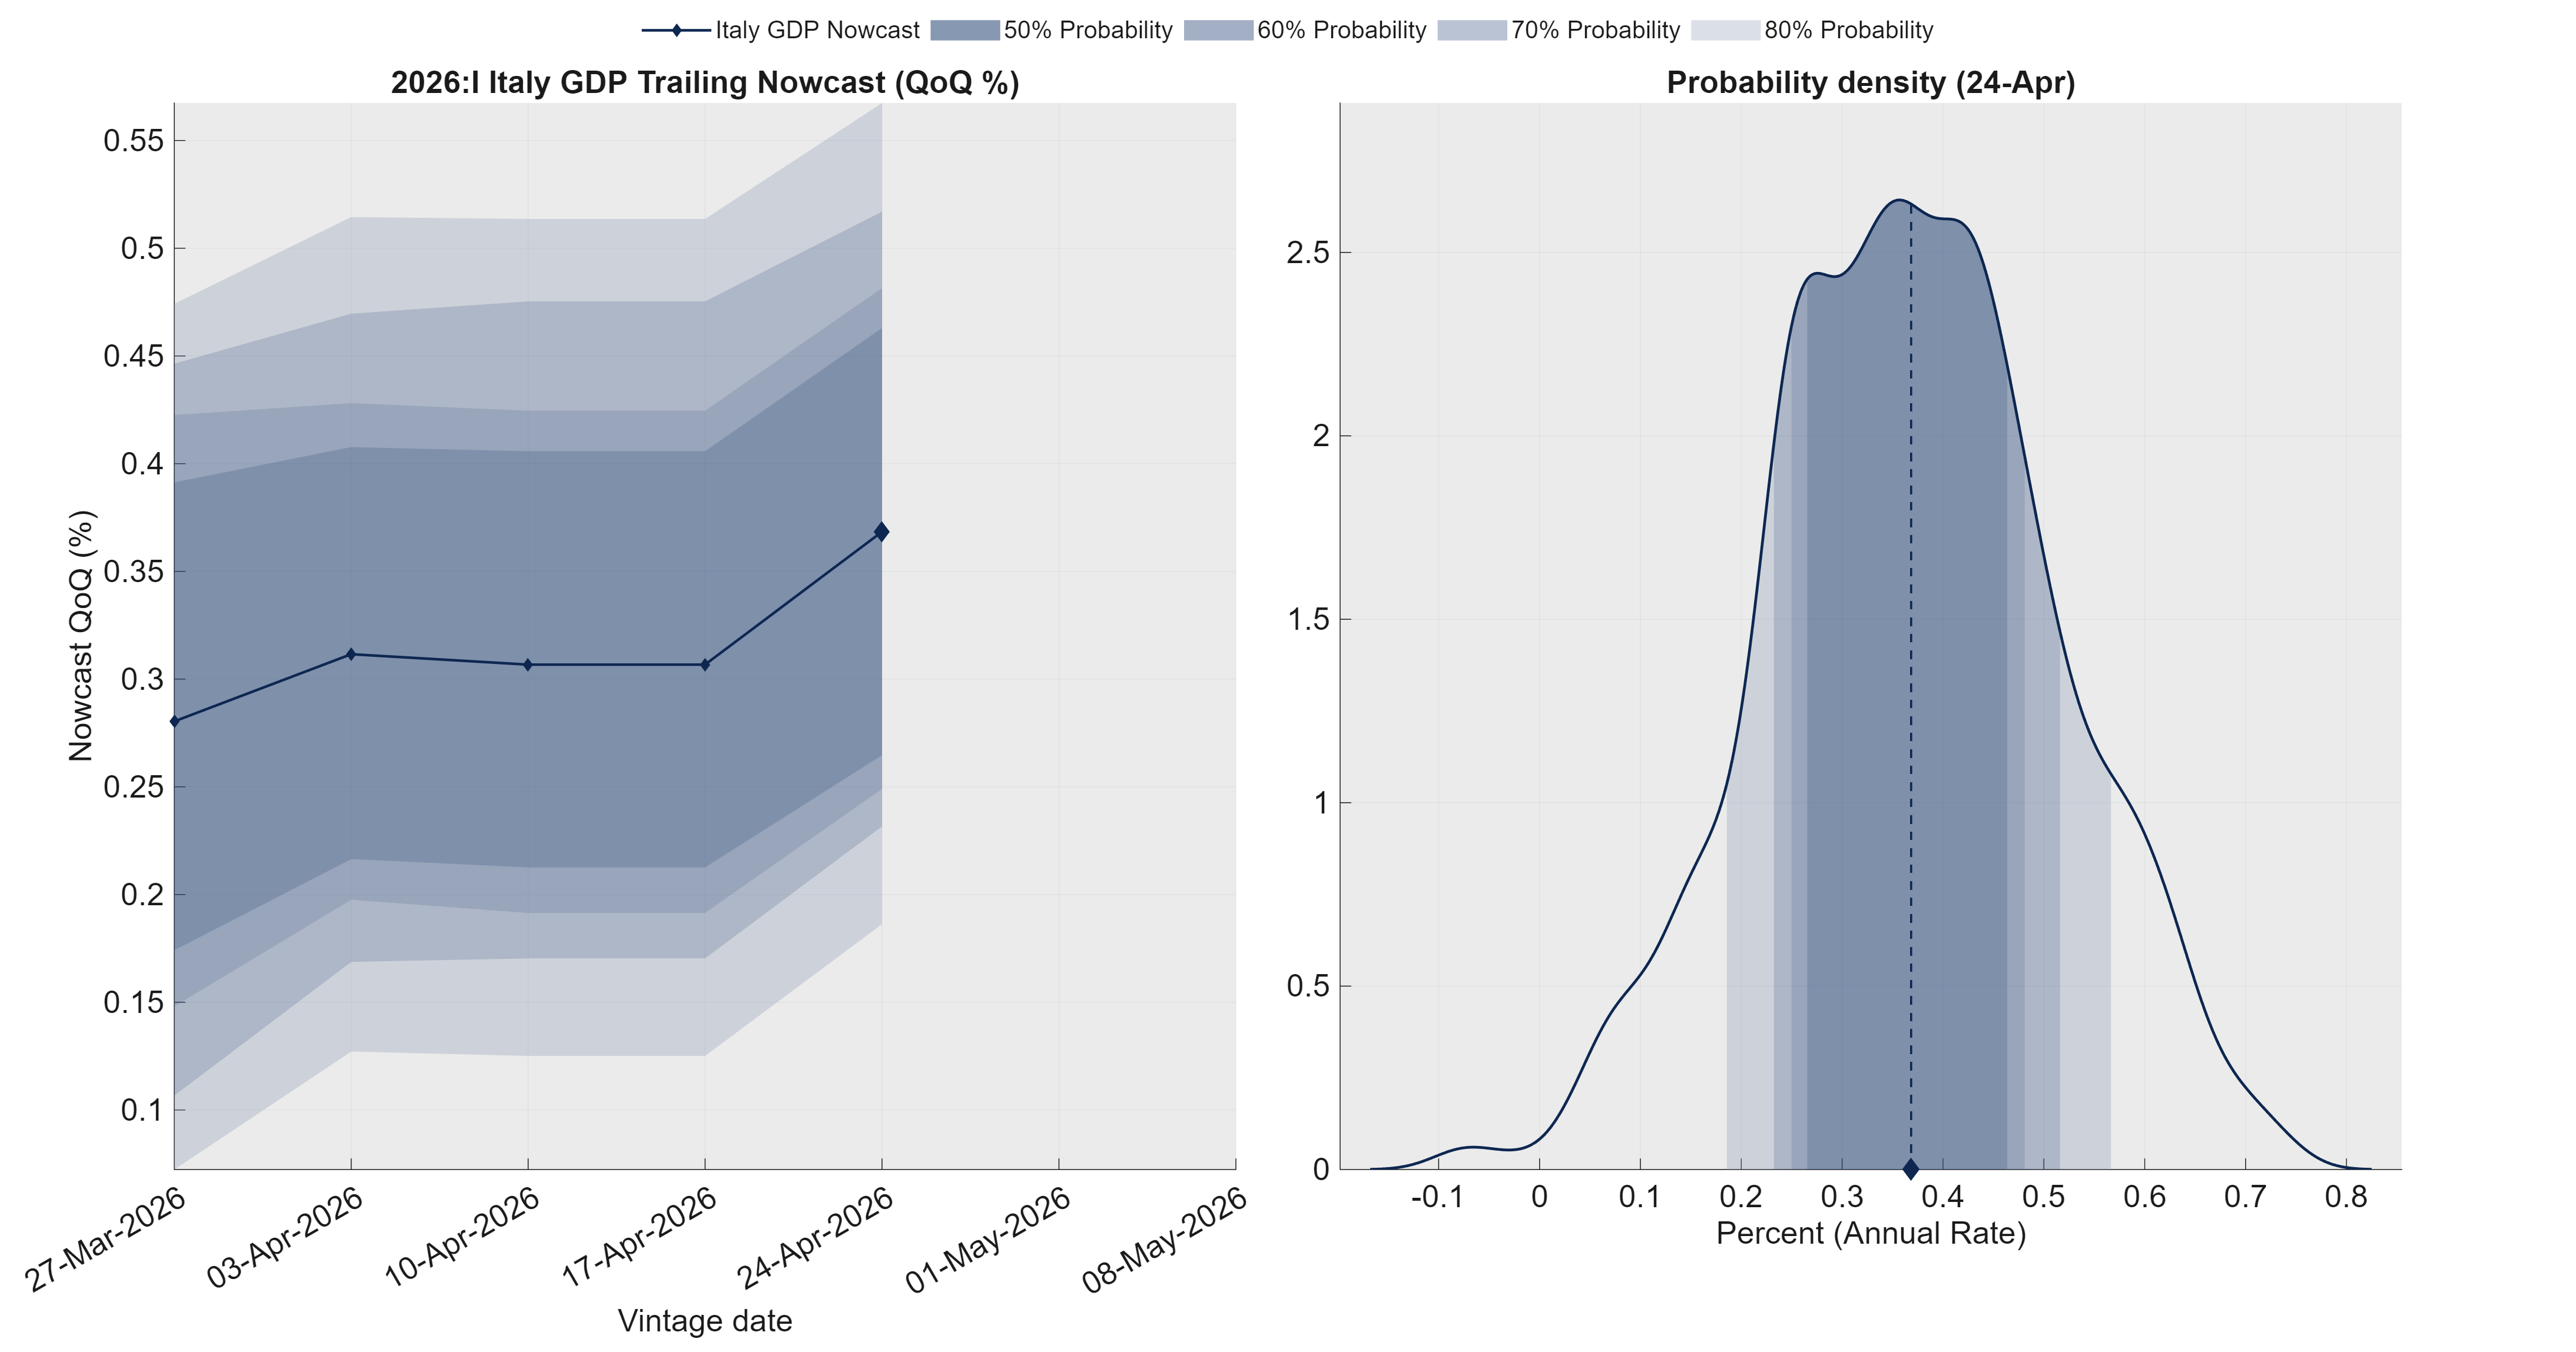
2. Trailing nowcast charts
The bands summarize model uncertainty, not a formal policy forecast range
Trailing nowcast and distribution – YoY growth
Trailing nowcast and distribution – QoQ growth
3. Trailing nowcast table
| Vintage date | Log level (p50) | YoY (%, p50) | QoQ (%, p50) |
|---|---|---|---|
| 24-Jul-2026 | 4.7223 | 1.6 | 0.8 |
| 17-Jul-2026 | 4.7223 | 1.6 | 0.8 |
| 10-Jul-2026 | 4.7225 | 1.6 | 0.8 |
| 03-Jul-2026 | 4.7226 | 1.6 | 0.8 |
| 26-Jun-2026 | 4.7229 | 1.7 | 0.9 |
| 19-Jun-2026 | 4.7229 | 1.7 | 0.9 |
| 12-Jun-2026 | 4.7232 | 1.7 | 0.9 |
| 05-Jun-2026 | 4.7218 | 1.5 | 0.7 |
| 29-May-2026 | 4.7195 | 1.3 | 0.6 |
| 22-May-2026 | 4.7192 | 1.3 | 0.6 |
| 15-May-2026 | 4.7176 | 1.1 | 0.4 |
| 08-May-2026 | 4.7165 | 1.0 | 0.3 |
| 01-May-2026 | 4.7139 | 0.8 | 0.1 |
| 24-Apr-2026 | 4.7170 | 1.1 | 0.2 |
| 17-Apr-2026 | 4.7152 | 0.9 | 0.1 |
| 10-Apr-2026 | 4.7157 | 0.9 | 0.1 |
| 03-Apr-2026 | 4.7156 | 0.9 | 0.1 |
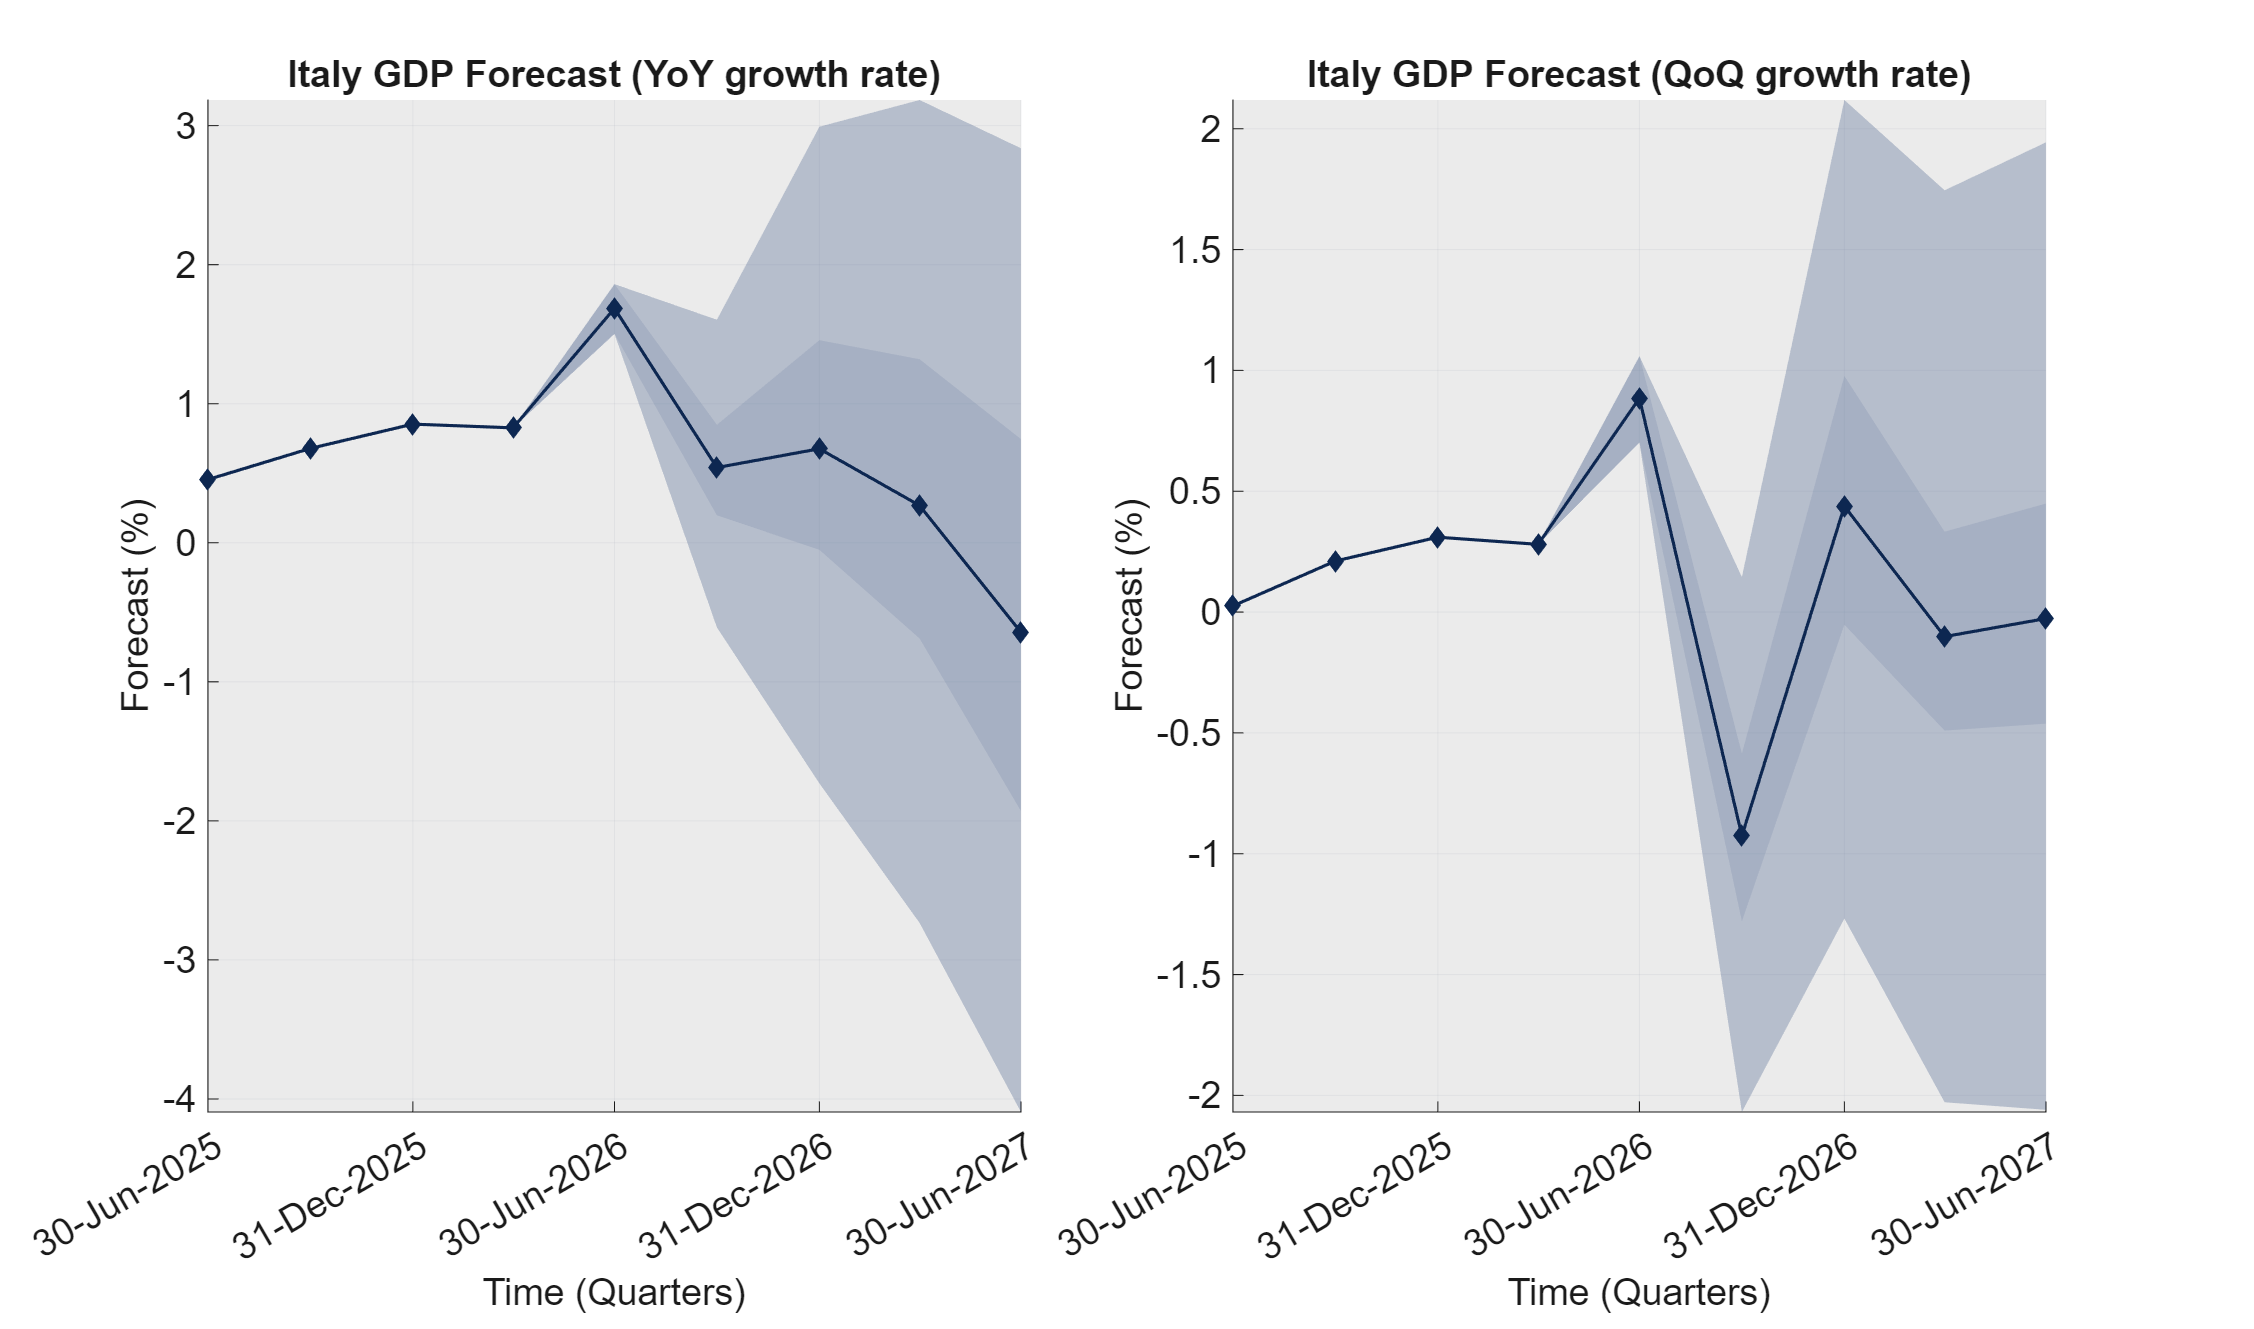
4. Short-run GDP projection charts
5. Interpretation of release values
Release values represent period-on-period changes. For log-transformed series, they approximate percentage growth rates, while for level series they represent absolute changes (for example, percentage-point changes for rates and index-point changes for survey balances).
| Series | Transformation | Interpretation of release value |
|---|---|---|
| Retail | Log | Month-on-month growth rate (%) |
| UNR | Level | Change in percentage points (pp) |
| ConsumerConf | Level | Change in index points |
| IndustrialConf | Level | Change in index points |
| IPI | Log | Month-on-month growth rate (%) |
| IPI-DE | Log | Month-on-month growth rate (%) |
| HICP | Log | Month-on-month growth rate (%) |
| EURIBOR-1Y | Level | Change in percentage points (pp) |
| EXP | Log | Month-on-month growth rate (%) |
| IMP | Log | Month-on-month growth rate (%) |
| RGDP | Log + quarterly-to-monthly fill | Approx. monthly growth rate (%) |
6. Data updates since previous vintage
6A. New releases
Below we list only the genuinely new releases, i.e. observations that were missing in the previous vintage and become available in the current one. The last column reports the release value, i.e. the period-on-period change implied by the current vintage (for log-transformed series, approximately a growth rate in %; for level series, an absolute change).
| From vintage | To vintage | Series | Observation date | New value | Release value |
|---|---|---|---|---|---|
| 10-Jul-2026 | 17-Jul-2026 | EXP | 31-May-2026 | 10.94 | 0.20 |
| 10-Jul-2026 | 17-Jul-2026 | IMP | 31-May-2026 | 10.87 | 1.45 |
| 03-Jul-2026 | 10-Jul-2026 | IPI | 31-May-2026 | 4.55 | -0.32 |
| 03-Jul-2026 | 10-Jul-2026 | IPIDE | 31-May-2026 | 4.52 | 0.77 |
| 26-Jun-2026 | 03-Jul-2026 | ConsumerConf | 30-Jun-2026 | -22.20 | -0.90 |
| 26-Jun-2026 | 03-Jul-2026 | IndustrialConf | 30-Jun-2026 | -6.40 | 0.50 |
| 26-Jun-2026 | 03-Jul-2026 | EURIBOR1Y | 30-Jun-2026 | 2.80 | -0.01 |
| 26-Jun-2026 | 03-Jul-2026 | Retail | 31-May-2026 | 4.58 | -0.31 |
| 26-Jun-2026 | 03-Jul-2026 | UNR | 31-May-2026 | 5.00 | -0.10 |
| 12-Jun-2026 | 19-Jun-2026 | EXP | 30-Apr-2026 | 10.93 | -2.07 |
| 12-Jun-2026 | 19-Jun-2026 | IMP | 30-Apr-2026 | 10.86 | -0.49 |
| 05-Jun-2026 | 12-Jun-2026 | IPI | 30-Apr-2026 | 4.55 | 0.42 |
| 05-Jun-2026 | 12-Jun-2026 | IPIDE | 30-Apr-2026 | 4.51 | 0.22 |
| 29-May-2026 | 05-Jun-2026 | ConsumerConf | 31-May-2026 | -21.30 | 2.50 |
| 29-May-2026 | 05-Jun-2026 | IndustrialConf | 31-May-2026 | -6.80 | -0.10 |
| 29-May-2026 | 05-Jun-2026 | EURIBOR1Y | 31-May-2026 | 2.80 | 0.06 |
| 29-May-2026 | 05-Jun-2026 | Retail | 30-Apr-2026 | 4.58 | 0.00 |
| 29-May-2026 | 05-Jun-2026 | UNR | 30-Apr-2026 | 5.10 | -0.10 |
| 15-May-2026 | 22-May-2026 | EXP | 31-Mar-2026 | 10.96 | 4.09 |
| 15-May-2026 | 22-May-2026 | IMP | 31-Mar-2026 | 10.87 | 4.70 |
| 08-May-2026 | 15-May-2026 | IPI | 31-Mar-2026 | 4.55 | 0.74 |
| 08-May-2026 | 15-May-2026 | IPIDE | 31-Mar-2026 | 4.51 | -0.77 |
| 01-May-2026 | 08-May-2026 | Retail | 31-Mar-2026 | 4.58 | 0.41 |
| 24-Apr-2026 | 01-May-2026 | ConsumerConf | 30-Apr-2026 | -23.90 | -3.70 |
| 24-Apr-2026 | 01-May-2026 | IndustrialConf | 30-Apr-2026 | -6.90 | -0.80 |
| 24-Apr-2026 | 01-May-2026 | EURIBOR1Y | 30-Apr-2026 | 2.75 | 0.18 |
| 24-Apr-2026 | 01-May-2026 | UNR | 31-Mar-2026 | 5.20 | -0.10 |
| 24-Apr-2026 | 01-May-2026 | RGDP | 31-Mar-2026 | 4.71 | NaN |
6B. Value changes
Below we list only the changes in the already published data between consecutive vintages. The last column reports the revision, computed as New value minus Old value.
| From vintage | To vintage | Series | Observation date | Old value | New value | Revision |
|---|---|---|---|---|---|---|
| 10-Jul-2026 | 17-Jul-2026 | EXP | 30-Apr-2026 | 10.9345 | 10.9356 | 0.0011 |
| 10-Jul-2026 | 17-Jul-2026 | IMP | 30-Apr-2026 | 10.8591 | 10.8601 | 0.0011 |
| 10-Jul-2026 | 17-Jul-2026 | EXP | 31-Mar-2026 | 10.9569 | 10.9563 | -0.0006 |
| 10-Jul-2026 | 17-Jul-2026 | IMP | 31-Mar-2026 | 10.8654 | 10.8651 | -0.0004 |
| 03-Jul-2026 | 10-Jul-2026 | IPI | 30-Apr-2026 | 4.5528 | 4.5518 | -0.0011 |
| 03-Jul-2026 | 10-Jul-2026 | IPIDE | 30-Apr-2026 | 4.5098 | 4.5120 | 0.0022 |
| 26-Jun-2026 | 03-Jul-2026 | IndustrialConf | 31-May-2026 | -6.8000 | -6.9000 | -0.1000 |
| 26-Jun-2026 | 03-Jul-2026 | Retail | 30-Apr-2026 | 4.5839 | 4.5880 | 0.0041 |
| 12-Jun-2026 | 19-Jun-2026 | EXP | 31-Mar-2026 | 10.9566 | 10.9569 | 0.0003 |
| 12-Jun-2026 | 19-Jun-2026 | IMP | 31-Mar-2026 | 10.8665 | 10.8654 | -0.0011 |
| 05-Jun-2026 | 12-Jun-2026 | IPIDE | 31-Mar-2026 | 4.5053 | 4.5098 | 0.0044 |
| 29-May-2026 | 05-Jun-2026 | Retail | 31-Mar-2026 | 4.5819 | 4.5880 | 0.0061 |
| 29-May-2026 | 05-Jun-2026 | RGDP | 31-Mar-2026 | 4.7134 | 4.7143 | 0.0010 |
| 22-May-2026 | 29-May-2026 | ConsumerConf | 30-Apr-2026 | -23.9000 | -23.8000 | 0.1000 |
| 22-May-2026 | 29-May-2026 | IndustrialConf | 30-Apr-2026 | -6.9000 | -6.8000 | 0.1000 |
| 24-Apr-2026 | 01-May-2026 | ConsumerConf | 31-Mar-2026 | -20.0000 | -20.1000 | -0.1000 |
| 24-Apr-2026 | 01-May-2026 | IndustrialConf | 31-Mar-2026 | -5.8000 | -6.0000 | -0.2000 |
7. Dataset
Data coverage
| Series | Description | Start | End |
|---|---|---|---|
| Retail | Turnover and volume of sales in wholesale and retail trade, SA, monthly. | M | EUROSTAT |
| UNR | Unemployment Rate, SA, monthly. | M | EUROSTAT |
| ConsumerConf | Eurostat’s consumer confidence, SA, monthly. | M | EUROSTAT |
| IndustrialConf | Eurostat’s industrial confidence (manufacturing proxy), SA, monthly. | M | EUROSTAT |
| IPI | Industrial Production Index, SA, monthly. | M | EUROSTAT |
| IPI-DE | Industrial Production Index, SA, monthly. | M | EUROSTAT |
| HICP | HICP, NSA, monthly. | M | EUROSTAT |
| EURIBOR-1Y | Euribor 1Y monthly avg (ECB). | M | ECB |
| EXP | Exports to World, SA, monthly. | M | ISTAT |
| IMP | Imports from World, SA, monthly. | M | ISTAT |
| RGDP | Real GDP, SA, chain‑linked (quarterly). | Q | EUROSTAT |
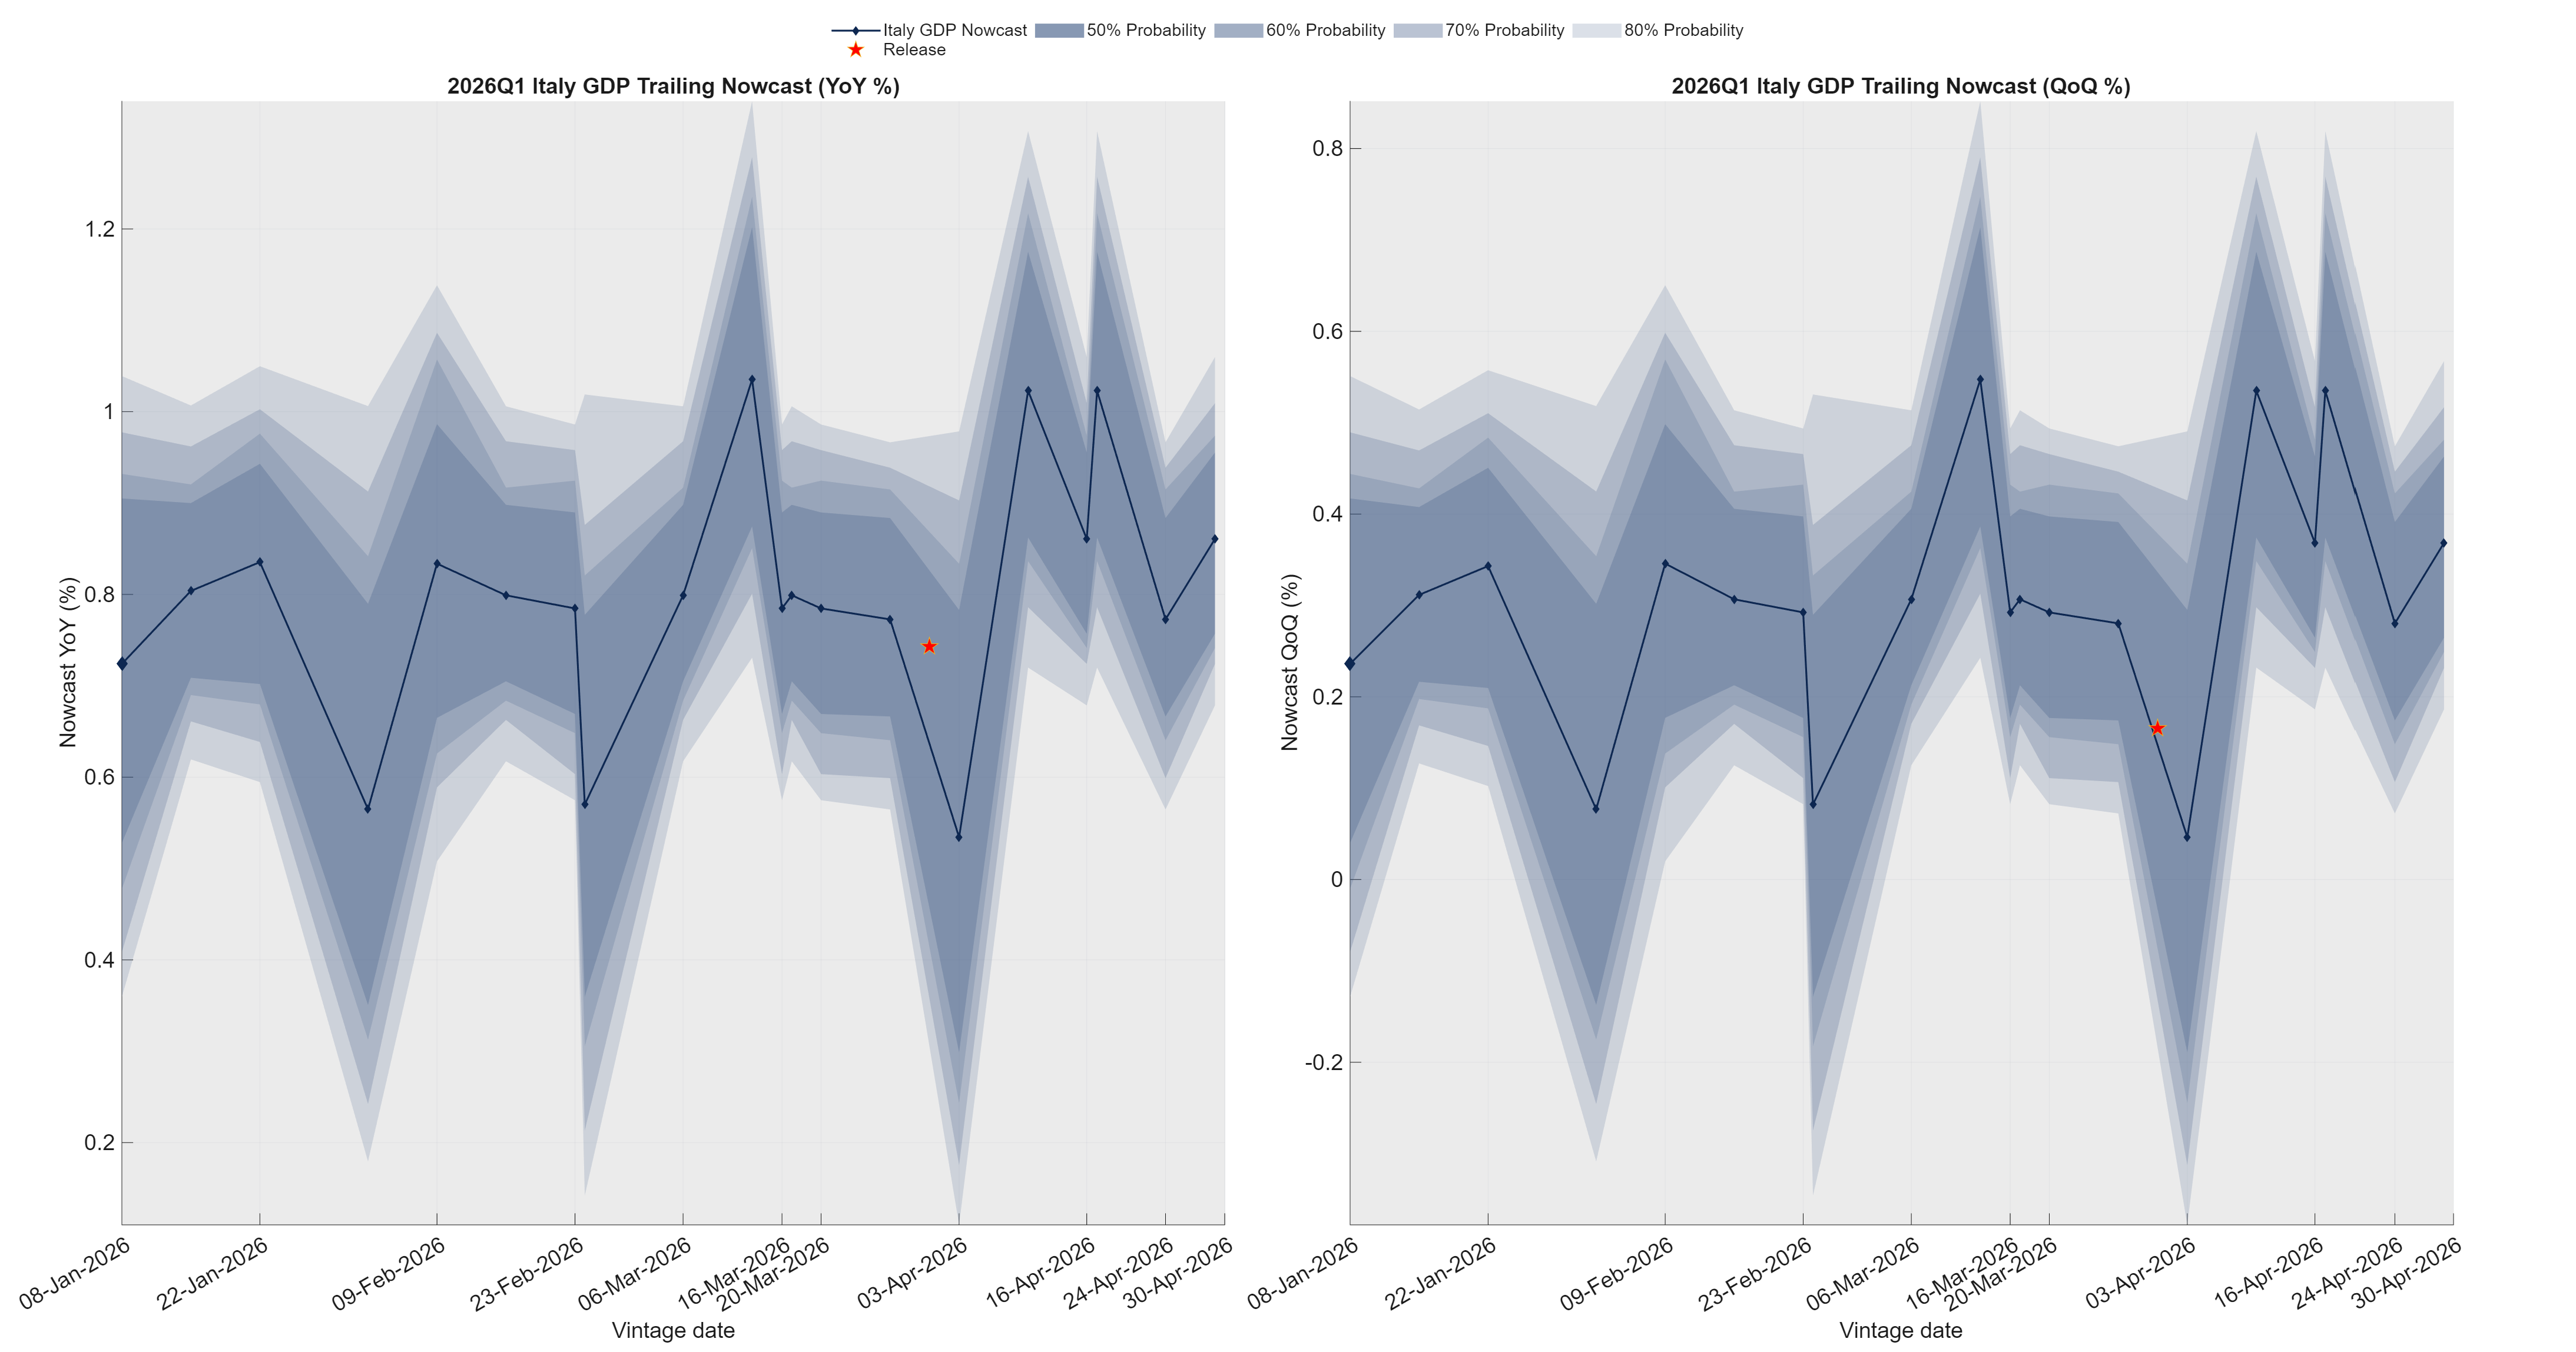
8. Previous-quarter nowcast vs realized GDP
This chart compares the sequence of nowcasts for the previous quarter with the subsequently released GDP estimate.
Report automatically generated on 24-Jul-2026 12:08:30.